Is TAFTO, or any other word of mouth audience development program, genuinely capable of having any measurable impact on concert attendance? To help figure out a quantifiable answer to that question Bill Harris, a friend and colleague of mine, came up with a brilliant solution to address these issues which grew into the TAFTO contribution below. Furthermore, this is another fabulous example of a TAFTO entry created by “thinking outside the box” which seem to pop up every year. As such, while attempting to write an introduction for this TAFTO entry I discovered that it was simply impossible to fit everything I needed to say into two paragraphs. As such, I used my April column at The Partial Observer to publish an article which serves as a suitable introduction and also provides some additional background. In the meantime, every orchestra manager and board member out there from the biggest budget ensemble right through volunteer groups must take time out of their day and read Bill’s contribution. It simply is that significant. ~ Drew McManus
Is TAFTO a good idea? Really?
Is TAFTO a good idea? Really? Or is it simply a way to shift the responsibility for less-than-desired attendance from symphony orchestra management to the audience itself? If orchestras have money for advertising and PR, expertise in all things musical, and the attention of critics and the press, what can we as individual concert-goers possibly do to help?
How can we answer such questions?
What if we create a simple model of the way people decide to become concert-goers and use that to help us think about TAFTO? Perhaps the process of working with that model will teach us something about working with the more complex real world. Perhaps it will help us answer these questions.
Before we start, I have a request to ask of each of you. Pull out a clean sheet of paper, write “TAFTO,” your name, and the date across the top, and then write down your answer to two questions:
- What sort of effect do you think TAFTO might have on orchestra attendance?
- What are the key factors for its success? What two or three things must Drew, TAFTO adherents, and orchestras do to ensure the best results from this effort? Can you rank them in order from most to least important?
Don’t proceed until you’ve written that down and saved it somewhere, for you might learn more that way. Thanks.
A model of symphony orchestra audiences
Often it seems we can learn the most from the simplest models. Let’s start by dividing the people in world into three groupings: those who have never attended a symphony concert, those who currently attend, and those who have attended but have given up on attending future concerts for whatever reason. I’ll call those groupings “stocks” of people, and I’ll name them NotYets, Nows, and NoMores:

Each stock is represented in the diagram by a rectangle. In this model, NotYets can only stay NotYets or become Nows, and Nows can only stay Nows or become NoMores. There’s no movement backwards in the chain. Of course, we could create a model that allowed NoMores to become Nows again; in fact, thinking about such alternatives is precisely the sort of thing I’d do with a client as we worked to make sense of such a problem.
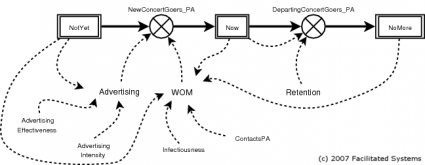
Each year, some number of NotYets become Nows. Let’s call that flow NewConcertGoers_PA, where “PA” stands for the Latin per annum and is shorter than “per year”. Similarly, I’ll call the number of Nows who become NoMores each year DepartingConcertGoers_PA. I’ll show those flows on the diagram as valves on pipes running between the appropriate stocks.
Before we go much further and I risk misleading you, these stocks don’t represent numbers of people; they represent numbers of “ticket-buying groups.” It seems likely that families and friends don’t always make independent decisions to attend a concert; they make mutual decisions.
Furthermore, these stocks represent small groups of people, not tickets sold. I could extend this model to include how many tickets the average ticket-buying group purchases each year; I haven’t done that here.
What determines how big those flows are?
In the 1960s, Dr. Frank Bass developed a marketing model I’ll adopt for our purposes. His model predicts the number of adopters of a product based on both external and internal factors. External influence comes from advertising or other external media; internal influence comes from word-of-mouth (WOM) influence from other adopters.

While we wish that orchestras retained all their audiences from season to season, we recognize that’s highly unlikely. If Retention is the fraction of the current Nows retained for next year, then the fraction (1 – Retention) of the current Nows will become NoMores next year.
It’s not clear from the diagram what determines Advertising, WOM, or Retention. The full stock and flow diagram gives more detail about what drives those three key factors:
Let’s Get Real
That diagram isn’t the real model, for it can’t do anything. It’s at best a picture or map of the real model. The model comprises a set of equations written in a form that a computer can process and provide values for any of the variables in the model.
A computer model doesn’t have to be scary; let’s walk through this one together. This is the most mathematical part of the article; you can safely skip it on your first reading if your eyes start to glaze over. On the other hand, you might find you can follow the gist of this story more easily than you think.
I’ll start with the instructions to the computer that tell it the names of the stocks. This simulator, MCSim, refers to stocks as state variables:

That simply gives the names of the three stocks (states) in a format the computer recognizes. Anything after a # is a comment, intended to improve comprehension for us people; the computer ignores it.
The values of these three stocks vary over time. I need to define how those three stocks vary as time passes:
![]()
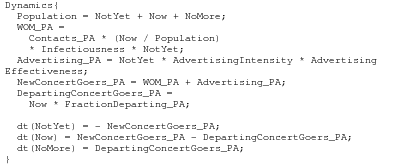
The dt(Now) symbol is used to indicate the formula that describes how Now changes as time passes. As you can see from the diagram, it increases by NewConcertGoers_PA and decreases by DepartingConcertGoers_PA. You can figure out dt(NotYet) and dt(NoMore).
Where do the two flows NewConcertGoers_PA and DepartingConcertGoers_PA originate? Let’s start with the simplest: DepartingConcertGoers_PA. While we wish people who started attending concerts would find them so compelling they’d stay concert-goers forever, we know people’s tastes change sometimes, and we know we’ll lose some. I’ll assume a constant fraction of the Nows give up each year:
![]()
For example, if 4% of Nows give up on classical music each year, FractionDeparting_PA will be set to 0.04. Incidentally, a 4% departure fraction corresponds to an average Now remaining a Now for 25 years (the reciprocal of 0.04).
Because it’s easier to write about audience retention, we’ll often speak of retention instead:
![]()
When we speak later of “high retention”, we’ll be referring to the relative level of RetentionFraction.
As the last diagram shows, we get new concert-goers each year through advertising and WOM:
![]()
Advertising is only a bit more challenging to explain than retention:
![]()
In this equation, I’ll let AdvertisingEffectiveness represent the fraction of NotYets who would become Nows through advertising in a year, given a “normal” investment in advertising. AdvertisingIntensity can be set equal to 1 in that case; if you devote only half the normal effort to advertising, AdvertisingIntensity would be set to 0.5.
You might guess that I’m saving word-of-mouth selling for last because it’s more complex, and you’d be right. Here’s the equation:
![]()
Let’s dissect it with care. A random NotYet might become a Now as a result of encountering and engaging with a Now. That might be through the persuasive powers of the Now, or it might be because the NotYet is tired of sitting home alone while all the NotYet’s Now friends attend concerts.
A particular NotYet will encounter Contacts_PA people each year. That’s likely not a casual passing on the street; it implies some degree of influence between the two.
Some fraction of those contacts (Now / Population) will be with Nows.
Some fraction (Infectiousness) of those contacts will result in a NotYet becoming a Now.
Finally, we multiply that by the total number of NotYets to find the total number of people converted to Nows each year through WOM.
Note that we’ve used Population in that equation without defining it; it’s simply
![]()
Assembling all those pieces, we have the Dynamics section of the model, which describes how each variable changes as time passes:
Of course, it doesn’t do any good to calculate things if we can’t see the results. MCSim always lets us look at the values of states; we’d also like to look at other variables:

The Dynamics section tells the computer how each stock varies as time passes, but it doesn’t tell it where they start. The Initialize section defines the initial values for each stock:

We’ll associate those with real numbers in the simulation file, along with the values of other parameters we’ve used but not yet defined. That way, we can easily run different experiments with different parameter values.
Just so you can see it all at once, here’s the entire model:

Everything is as you’ve already seen, except that I’ve added a few default parameters. That’s only 40 lines of text, divided into 5 basic chunks. Does it make sense now?
So what?
What can we expect from such a model? Hopefully, we can see how various combinations of attention to advertising, word-of-mouth, and audience retention might affect future audience size. The results won’t be perfect, but they should show us which approaches work better.
A few initial experiments shared with Drew showed that we could deplete the population of NotYets, and that would affect the ability to attract new audience members. As a result, I created a new model with the potential for births, immigration, and deaths. While I’ll show results from that model below, the results aren’t fundamentally different. The new model is complex enough so I didn’t want to start with that, but it’s not so complex that you can’t understand it now.
Here’s our initial experiment with possibly reasonable figures for all the model parameters:
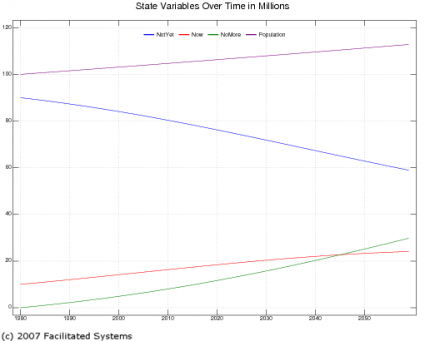
As you can see, total population is growing slightly over the 80-year time horizon I’ve chosen. The number of Nows, represented by the red line, grows slightly, but it’s overtaken by the number of NoMores in green around the year 2045.
That’s not good, but I’ll admit that I don’t have the data to calibrate this model well. With custom data from a particular orchestra covering their particular situation, one could create a more accurate model. That said, models such as this are generally intended to help one design effective policies (rules and guidelines, both formal and informal, by which decisions are made) to achieve certain goals rather than to predict the precise number of tickets that will be sold for next Friday’s concert.
What if we look at this slightly differently? Instead of seeing what it does in one experiment, let’s run a series of experiments as we vary each of the three factors—advertising, WOM, and retention—and see which factor has the most influence over the number of Nows.
Varying the level of advertising, WOM, and the fraction leaving each year (1 minus the retention rate) both up and down by 50%, we can create a mosaic of graphs:
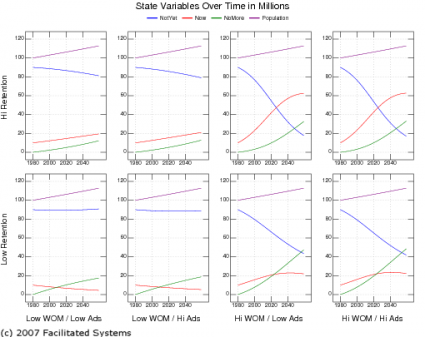 In this case, we can learn by comparing one half of the graphs to the other half. For example, the four on the left all have low WOM, while the four on the right have high WOM. Clearly, high WOM generates more Nows than low WOM, at least given the assumptions in this model.
If we compare the top row with the bottom row, it appears that high retention is somewhat better than low retention. That seems especially true in the high WOM case.
What about advertising? Comparing the second and fourth columns with the first and third, there seems to be only a small difference.
To the extent this model is correct, WOM is clearly the biggest factor for generating Nows, with retention in second place. Advertising hardly seems to count.
That’s potentially good news for TAFTO, for TAFTO itself (as opposed to Drew’s advertising of TAFTO) is largely a WOM campaign. It’s also potentially useful news for orchestras and orchestra associations, informing them which policies might be more beneficial in achieving their goals.
That’s potentially very discouraging to orchestras who spend money each year advertising their concerts, but I don’t think pessimism is necessarily warranted. As I noted at the start, this model seeks to determine how we create potential concert-goers. I suspect that advertising has a much stronger influence on ticket purchases by Nows than on generating new Nows: how else does someone find out what concerts they can attend this week? It certainly seems reasonable to extend a model such as this to cover ticket sales, if that were the focus of the work.
But that’s not TAFTO
Why did I say that’s only potentially good news for TAFTO? The model you’ve seen so far assumes that WOM effectiveness increases across the entire population of concert-goers (Nows) (or at least that the average increases as much as if everyone’s effectiveness had increased by 50%). Even as influential as Adaptistration is, it’s likely not that influential.
The next step is to create a model with a unique stock of TAFTOs: people and groups who have become increasingly interested in and effective at getting others to attend concerts.
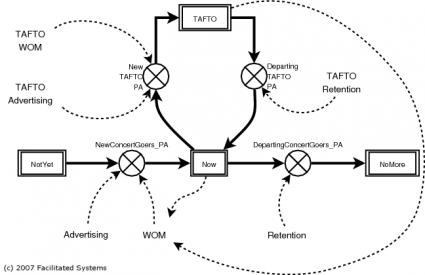
I’ll use the same basic structure for generating TAFTOs as I did for generating Nows, consisting of both advertising (what Drew is doing) and WOM. As with Nows, I’ll presume some fraction of TAFTOs lose their zeal each year; I’ll presume that they return to being normal Nows.
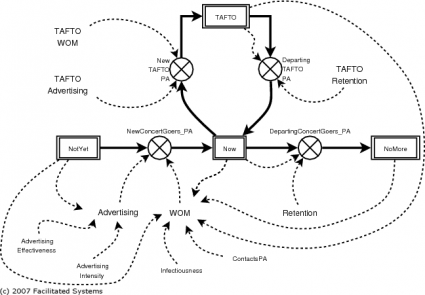
The only real difference between a Now and a TAFTO is their infectiousness. I’ll presume that interactions between a NotYet and a TAFTO are more likely to lead to a new Now than interactions between a NotYet and a Now. You can see the full model if you want; I won’t go through it here.
TAFTO Results
What happens when I run this expanded model? How many Nows do we get as a result of the TAFTO program?
It doesn’t make much sense to plot the same mosaic of graphs as before, for the numbers aren’t huge. Even at its best, given the parameters I’ve chosen, TAFTO only generates just over 2 million more Nows by the year 2059. Out of a population of perhaps 50 million Nows, that difference is hard to see on a small graph.
Let’s look at it differently. Since we’re investigating the effect of TAFTO, I’ll set the basic model to it middle settings—the settings used to produce the very first graph. Then I’ll vary the four main TAFTO parameters—TAFTO’s WOM effect on creating Nows, the effectiveness of Drew’s advertising in creating TAFTOs, the WOM effect in creating new TAFTOs, and the fraction of TAFTOs that return to being normal Nows each year—up and down by 50% to see their effect on Nows. As before, we can figure out which factors have the most influence.
A graph of the number of Nows in the year 2059 makes it clear that the different factors do have an influence:
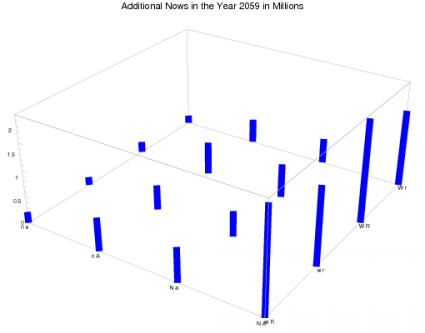
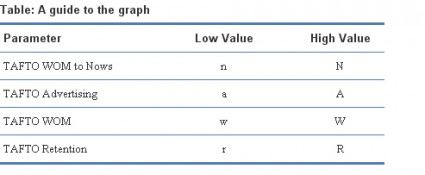
TAFTO WOM to Nows is the effect of TAFTO on turning NotYets into Nows; the other three parameters describe the way the TAFTO program creates more TAFTOs.
With all combinations of each of the four factors at their high and low levels, we have 16 different experiments. It’s easy to see we get the best results in the four scenarios where both the TAFTO WOM effect in generating Nows and the effect of advertising in generating new TAFTOs are high. In those scenarios, there’s a slight advantage from high retention of TAFTOs.
In this model, the effect of WOM in generating new TAFTOs doesn’t have much effect on generating new Nows. Does that make sense?
It seems to. There are lots of current concert-goers, and so effective WOM might be expected to play a significant role. There aren’t yet many TAFTOs that we know of, though, so it’s reasonable WOM won’t have as significant an effect in generating new TAFTOs. The fact that WOM towards NotYets and advertising to Nows both work together suggests the presence of a virtuous cycle: the more TAFTOs Drew can persuade to join the cause, the more Nows we’ll see, which will make it easier for Drew’s campaign to generate more TAFTOs.
So is TAFTO a good idea or not?
Based on this simple model, TAFTO may have a noticeable effect on symphony orchestra audience size. The effect isn’t huge; calculated as a percentage change from the average, there are about 13 percentage points difference between the best and worst numbers of Nows in 2059. That certainly beats doing nothing, though.
In plain English, for TAFTO to have maximum success, it seems we need four things:
- Drew should do the best job he can at enlisting people to participate in TAFTO.
- Those people who enlist should be as effective as they can be in getting people into concert halls. Aided by insights from TAFTO contributors, all of us TAFTOs can find what works best for our situations and personalities.
- Remembering the earlier results from the basic model, orchestras should focus on keeping newcomers from becoming disenchanted and leaving.
- If possible, it’s nice to keep TAFTO retention high.
Of those, the first two seem clearly the most important.
How certain am I of these conclusions? I’m somewhat certain. Were this a paid client engagement or a full-fledged research project, I’d test the model more using both additional data and insights from the client. We’d have more people to review the model structure, parameters, and results. We might decide that some of the parameters I’ve chosen should be adjusted. We’d have more people to propose alternative hypotheses and alternative ways of assessing results. Out of those expanded tests and out of the insights of more people, we might improve our confidence in these results, or we might discover something I haven’t uncovered here.
What’s the real return to orchestras from TAFTO? That would be an excellent question to explore using a somewhat extended model. Such a model could consider the costs of marketing and the revenue from ticket sales. Without such an effort, we can conjecture that TAFTO seems likely to get noticeable but not huge results.
Will every orchestra across the country see this sort of result? Unlikely. This model is dealing in averages (as in the average infectiousness of a Now or a TAFTO on a NotYet); certainly some locations will be more receptive to such a program, and some orchestras will be able to support it more effectively, while others are likely to see worse results.
Having admitted to limitations in this modeling effort, I still think the results are worth attending to. The models have suggested what factors are important, and they have suggested that a very low-cost, grass-roots effort may well have a noticeable effect.
Now I’m curious. Take out that piece of paper on which you wrote the answers to my questions. How do your answers compare to the ones indicated by the model? What can you learn by comparing the two?
If you want to learn more
You can find out more about the Bass diffusion model and its variants by searching on the Web. To see that model expressed in the sort of model we’ve been exploring, check out chapter 9 of John Sterman’s classic Business Dynamics: Systems Thinking and Modeling for a Complex World. If you’d like to see more about applying this approach to questions about the classical music business, see “Making musical sense with email.”